|
Brain Slice Electrophysiology
 Materials and Methods Materials and Methods
Animals C57Bl/6 male mice are obtained from Jackson Laboratories. For experiments involving “adult” mice, the animals are delivered at 5-6 weeks of age and housed in the VUMC animal care facility until they are sacrificed for experiments. For experiments involving “adolescent” mice, pregnant females are purchased from Jackson Laboratories, or breeding pairs of C57Bl/6 mice from Jackson Laboratories are maintained in the VUMC animal facility. Twenty to 24 day-old mice are taken directly from the nest with their dam and sacrificed for experiments. We have defined this age group (20-24 days) as “adolescent” because many behavioral (novelty-seeking, risk-taking, social reaffiliation) and hormonal changes that are hallmarks of adolescence in humans also occur between weaning and sexual maturity in rodents (reviewed by Spears, 2000, (Spear, 2000)). Three weeks of age is the typical weaning time for laboratory mice, so the mice we have examined are early adolescents. Animals are housed under a 12/12 hour light/dark cycle (lights on at 6 am), with food and water available ad libitum.
Slice Preparation
Mice are anaesthetized with isoflurane and sacrificed by decapitation. Brains are removed and placed in ice-cold Artificial Cerebro-Spinal Fluid (ACSF consisting of, in mM: NaCl, 124; KCl, 4.4; MgSO4, 1.2; NaH2PO4, 1; CaCl2, 2.5; NaHCO3, 26; glucose, 10) for 45 seconds. (In 0 Mg2+ experiments, NaCl replaced the MgSO4 in the bath ACSF mole-for-mole.) For accumbens recordings, the brain is blocked sagittally along the midline and side of each hemisphere using a chilled brain mold (Harvard Apparatus). Hemispheres are then glued, midline side up, to the plate of a Pelco vibratome. Sagittal slices are 350 mm thick. The NAc core is identified by its proximity to the anterior commissure and position relative to the fornix, lateral ventricle, and caudate/putamen.
Extracellular Extracellular Recordings
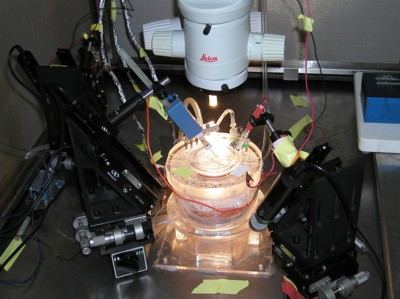
Extracellular recordings are made from slices in an interface-type chamber (Fine Science Tools). Slices are bathed in ACSF at 28-29oC in a humidified atmosphere of 95% O2 /5% CO2. Borosilicate glass recording electrodes (~1 MW, pulled on a Flaming/Brown Micropipette puller) are filled with ACSF or ACSF containing 0 Mg2+, as appropriate, for fEPSP recordings. pCLAMP 8.0 software (Axon Laboratories) is used for data acquisition and analysis. Stimuli which elicit approximately ½ of the maximal response (determined before each experiment using an input/output curve) are delivered every 20 seconds with a Grass S88 stimulator, and the response is acquired on either an Axoclamp 2B amplifier, or a DP-301 amplifier from Warner instruments. Both stimulating and recording electrodes are placed in the NAc core, approximately 500 mm apart. This arrangement of electrodes generates a well-characterized response consisting of two downward peaks in voltage. The first, termed N1, represents primarily non-synaptic axonal firing or cell-body depolarization, and is reduced by sodium channel blockade (Boeijinga et al., 1990), but not by glutamatergic receptor antagonists. The second, termed N2, is the synaptic response, as it is blocked by kynurenate ((Boeijinga et al., 1990) and NLS and REE, unpublished observations). Experiments in which the N1 response increases or decreases proportionally with the N2 response are excluded from analysis.
Intracellular Recordings
Intracellular recordings from medium spiny neurons are made in slices (prepared as described above) under the same experimental set-up as for extracellular recordings. Recording electrodes (100-150 MW) are filled with a 3M potassium acetate solution. Both stimulating and recording electrodes are placed in the NAc core. For synaptic response recordings, stimuli are delivered 10 sec apart.
Data Analysis
Electrophysiological data are analyzed using pCLAMP 8.0 software (Clampfit) to detect peak amplitudes. For assessing the frequency of LTP induction, a response is considered potentiated if the average of the peak responses from 20-25 minutes after the tetanus is significantly greater than the average peak responses in the 5 minutes immediately preceding the tetanus based on a paired t-test. For comparing the frequency of LTP induction across ages, Fisher’s exact test is performed using GraphPad InStat software.
(责任编辑:泉水) |
