我们热爱生命科学!-生物行
当前位置: 主页 > 生物技术 > 蛋白组学

用photoshop和ImageJ对Western Blot图片灰度分析

时间:2012-07-27 12:22来源:网络 作者:未知 点击: 1086次

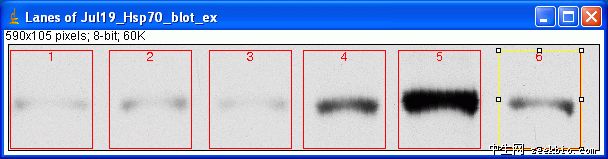
The ImageJ method (version 2)

This method is the Gel Analysis method outlined in the ImageJ documentation: . You may prefer to use it instead of the methods outlined below. There will likely be very little difference in the results between the various methods.

1. Open your file.

2. Go to Analyze>Gels>Gel Analyzer Options and click the boxes for Label With Percentages, Outline Lanes and Invert Peaks.

3. Choose the Rectangular Selection tool. Draw a rectangle around your first lane. Encompass some area of the lane above and below the band of interest. Edit July 2009: Note that for a gel with the lanes oriented vertically as shown here (i.e. the visible bands are horizontal across the image), you want to make your bounding rectangle taller than it is wide. However, if you have the image rotated so that the lanes are running horizontally, you need to make your bounding rectangle at least twice as wide as it is tall, at which point Image-J will recognize that your lanes are horizontal and it will allow you to move the box up or down the image to enclose the neighboring lanes.

4. Press the 1 button (or go to Analyze>Gels>Select First Lane). A new window will pop up with a copy of your image and a label over your first rectangular selection.

用photoshop和ImageJ对Western Blot图片灰度分析


5. Use the arrow keys to move the rectangle over the next lane. Press 2 (or go to Analyze>Gels>Select Next Lane) to place a selection around the lane. Repeat this for each lane on the membrane, moving the box and pressing 2 to place the selection.

用photoshop和ImageJ对Western Blot图片灰度分析


6. When finished, press 3 (or go to Analyze>Gels>Plot Lanes), which pops up a new window with a profile plot of each lane.

用photoshop和ImageJ对Western Blot图片灰度分析


7. Now choose the Straight Line selection tool. At the base of each peak, draw a line from one side of the peak to the other. This encloses the area of the peak. The tails to either side of the peak are the background signal. Note that if you have many lanes, the later lanes will be hidden at the bottom of the profile plot. To see these lanes, press and hold the space bar, and use the mouse to drag the profile plot upwards.

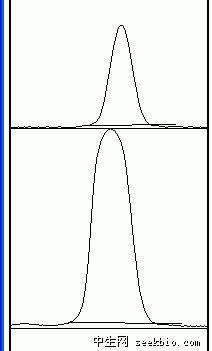
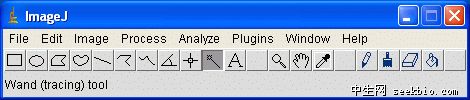
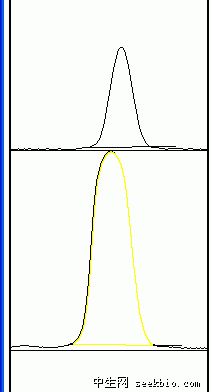
8. When each peak has been closed off at the base with the Straight Line tool, choose the Magic Wand (Wand tracing tool) from the tool palette.

用photoshop和ImageJ对Western Blot图片灰度分析


9. Using the spacebar and mouse, drag the profile plot back down until you are at the top peak. With the wand, click inside the peak. Repeat this for each peak as you go down the profile plot.

用photoshop和ImageJ对Western Blot图片灰度分析


10. When each peak has been selected, go to Analyze>Gels>Label Peaks. This labels each peak with its size expressed as a percentange of the total size of all the measured peaks. You can go to the Results window and choose Edit>Copy All to copy the results for placing in a spreadsheet.

用photoshop和ImageJ对Western Blot图片灰度分析


Note: If you accidentally click in the wrong place with the Magic Wand, the program still records that clicked area, and it will factor into the total area used to calculate the percentages. Obviously this would skew your results if you click in areas that aren't peaks. Therefore, if you should click in the wrong place, simply go to Analyze>Gels>Label Peaks to plot the current results, which displays these incorrect values, but more importantly resets the counter for the Results window. If you now go back to the Profile Plot and click in the peaks with the Magic Wand, the Results window clears and starts over. When you're sure you've clicked in the correct peaks without accidentally clicking in any wrong areas, you can go back to Analyze>Gels>Label Peaks and get the correct results.

(责任编辑:泉水)
顶一下
(0)
0%
踩一下
(0)
0%
------分隔线----------------------------
发表评论
请自觉遵守互联网相关的政策法规,严禁发布色情、暴力、反动的言论。
评价:
表情:
用户名: 验证码:点击我更换图片