我们热爱生命科学!-生物行

Bestfit介绍

时间:2006-03-24 18:11来源:bistone 作者:bioguider 点击: 833次

Fit Your Data to the Best Distribution... in Seconds!

   New BestFit 4.5 is the latest release of the world's most popular distribution fitting software! BestFit 4.5 is available as a stand-alone program or fully integrated with @RISK 4.5. Using advanced fitting algorithms, BestFit finds the distribution curve which best describes your data set. An Office-compatible interface, dazzling graphics, and capacity for larger data sets makes BestFit 4.5 the choice for professionals everywhere.

■ About BestFit
BestFit.BMP

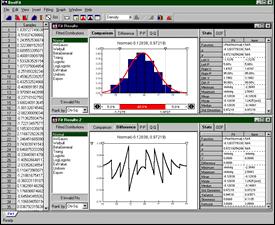
   BestFit's graphic overlays and statistics  allow you to easily compare fit results.  
   Click to view larger graphic.

   BestFit is a Windows program which finds the distribution that best fits your data. Simply import your data set into BestFit and click the Run Fit button. BestFit tests up to 27 different distribution types to find the best fit for your data. You can display results as presentation-quality graphs, or generate a full statistical report. Automatic goodness of fit testing will show you at a glance the accuracy of BestFit's answers. BestFit 4.5 is available as a stand-alone program or fully integrated with every copy of @RISK 4.5 Professional and Industrial, the risk analysis and simulation add-in for Excel.

■ BestFit in Industry 
   Who should use BestFit? Anyone who works with data can use BestFit. Apply it to business situations such as actuarial or claims adjustment, or to science and engineering problems such as oil well drilling or time between events. You can import data from your spreadsheet and export the results as graphic files to your report or presentation.

   So why fit distributions to data? Because if you don't (or if you select the wrong distribution), any analysis you run could have serious errors that can cost you time and money. If your data was generated by a random process, you'll get the best modeling results possible by accurately describing that process. And the best way to do that is with a fitted probability distribution.

■ BestFit Features

Fits to sample, density, or cumulative data

Takes data from text files, other Windows applications, Excel, or @RISK

Input up to 100,000 data points or pairs

Direct link to spreadsheet data in Microsoft Excel for automatic updating of fits

Direct link to @RISK functions for automatic updating

Filtering to remove outliers from data

Fits to 27 available distribution functions

Parameter selection using maximum-likelihood estimators and method of least squares

Uses three goodness of fit tests: Chi-square, Anderson-Darling, and Komolgorov-Smirnov

Complete statistics report, including goodness of fit, confidence levels, percentile and target values

Presentation-quality graphs displayed in BestFit or transferred automatically to Excel's native format

Sliding delimiters on all graphs make finding probabilities and target values easy

Ability to have multiple data sets and fits in a single project

Fit to custom list of predefined distributions you specify

Full control over Chi-square calculations

Preview and edit distributions

Distribution Palette gallery of Distributions

Alternate percentile parameters for distributions

Draw distributions freehand and fit them to standard distributions

On-line Help with "How Do I?" interface

■ Distribution List

BetaGeneral
Binomial
Chi-Square
Error Function
Erlang
Exponential
Extreme Value
Gamma
Geometric
Hypergeometric
Inverse Gaussian
IntUniform
Logistic
Log-Logistic
Lognormal
Lognormal2
Negative Binomial
Normal
Pareto
Pareto2
Pearson Type V
Pearson Type VI
Poisson
Rayleigh
Student's t
Triangular
Uniform
Weibull

(责任编辑:泉水)
顶一下
(26)
100%
踩一下
(0)
0%
------分隔线----------------------------
发表评论
请自觉遵守互联网相关的政策法规,严禁发布色情、暴力、反动的言论。
评价:
表情:
用户名: 验证码:点击我更换图片
特别推荐
推荐内容